Our online analysis tools are designed to help volcano observatory scientists
interrogate the interferograms processed in the LiCSAR
archive. This page describes how interferograms and time series are generated and gives some guidance
on how to use to them.
Our analysis tools are currently divided into three sections: (1) time series tools, (2) individual interferograms and (3) Machine Learning predictions of the location of any deformation. The start and end dates for the time series can be controlled using the sliders, while the user can select both the points to be plotted and a reference point or area using the buttons below the map of cumulative displacement. The slider at the base of the page allows the user to scroll through all of the interferograms and corresponding probability maps for volcano deformation.
Both the map of cumulative displacement and the time series for a selected point or area can be downloaded using the ‘save data as csv’ buttons. Links to download the individual interferograms are found at the bottom of the webpage.
Time series are constructed using LiCSBAS (Morishita et al., 2019), an open-source time series package integrated with the LiCSAR Sentinel-1 InSAR Processor. For the volcano portal, we clip interferograms to the area around the volcano and downsample to a size of 50 x 50 pixels for computational reasons. The selected area centred on the volcano is by default a box of side length 50 km (resulting in a pixel dimension of ~1 km), except for volcanoes where the footprint of deformation is expected to be significantly larger or smaller. LiCSBAS uses loop closure phase to identify interferograms with many unwrapping errors and removes them before construction of the timeseries. Incremental displacements are estimated using Single Value Decomposition of apparent displacement in each interferogram, with a weighted temporal constraint assuming linear displacement over network gaps. Standard deviations of each pixel velocity are estimated using bootstrap resampling, so that noisy pixels can be masked. Noise in the resulting time series is further reduced by applying a spatiotemporal filter that is high pass in time and low pass in space.
For each volcano we also provide the line-of-sight wrapped range change (cm), unwrapped range change (cm) and coherence for each individual interferogram. Links to geotiffs and png images for these are provided beneath the figures.
Flags of deformation in individual interferograms are obtained from the application of a deep learning approach to CCN (AlexNet) trained on a subset of real and synthetic interferograms (Anantrasirichai et al., 2018, 2019). Synthetic interferograms were designed to include both the range of deformation predicted by analytic elastic half space models, simulated turbulent and stratified atmosphere. These were combined with real examples drawn from LiCSAR automatic processing in 2016-2017 (from Etna, Ethiopia and the Galapagos) as well as earlier deformation in the Main Ethiopian Rift detected using ENVISAT imagery. Positive detections from an initial run were classified as deformation or atmosphere by experts and used for retraining. The detection threshold in the individual interferograms presented here is one fringe (2.8 cm), so we expect detections to be limited to rapid, relatively high magnitude deformation. A lack of flagging should therefore not be interpreted as a lack of any volcanic deformation.
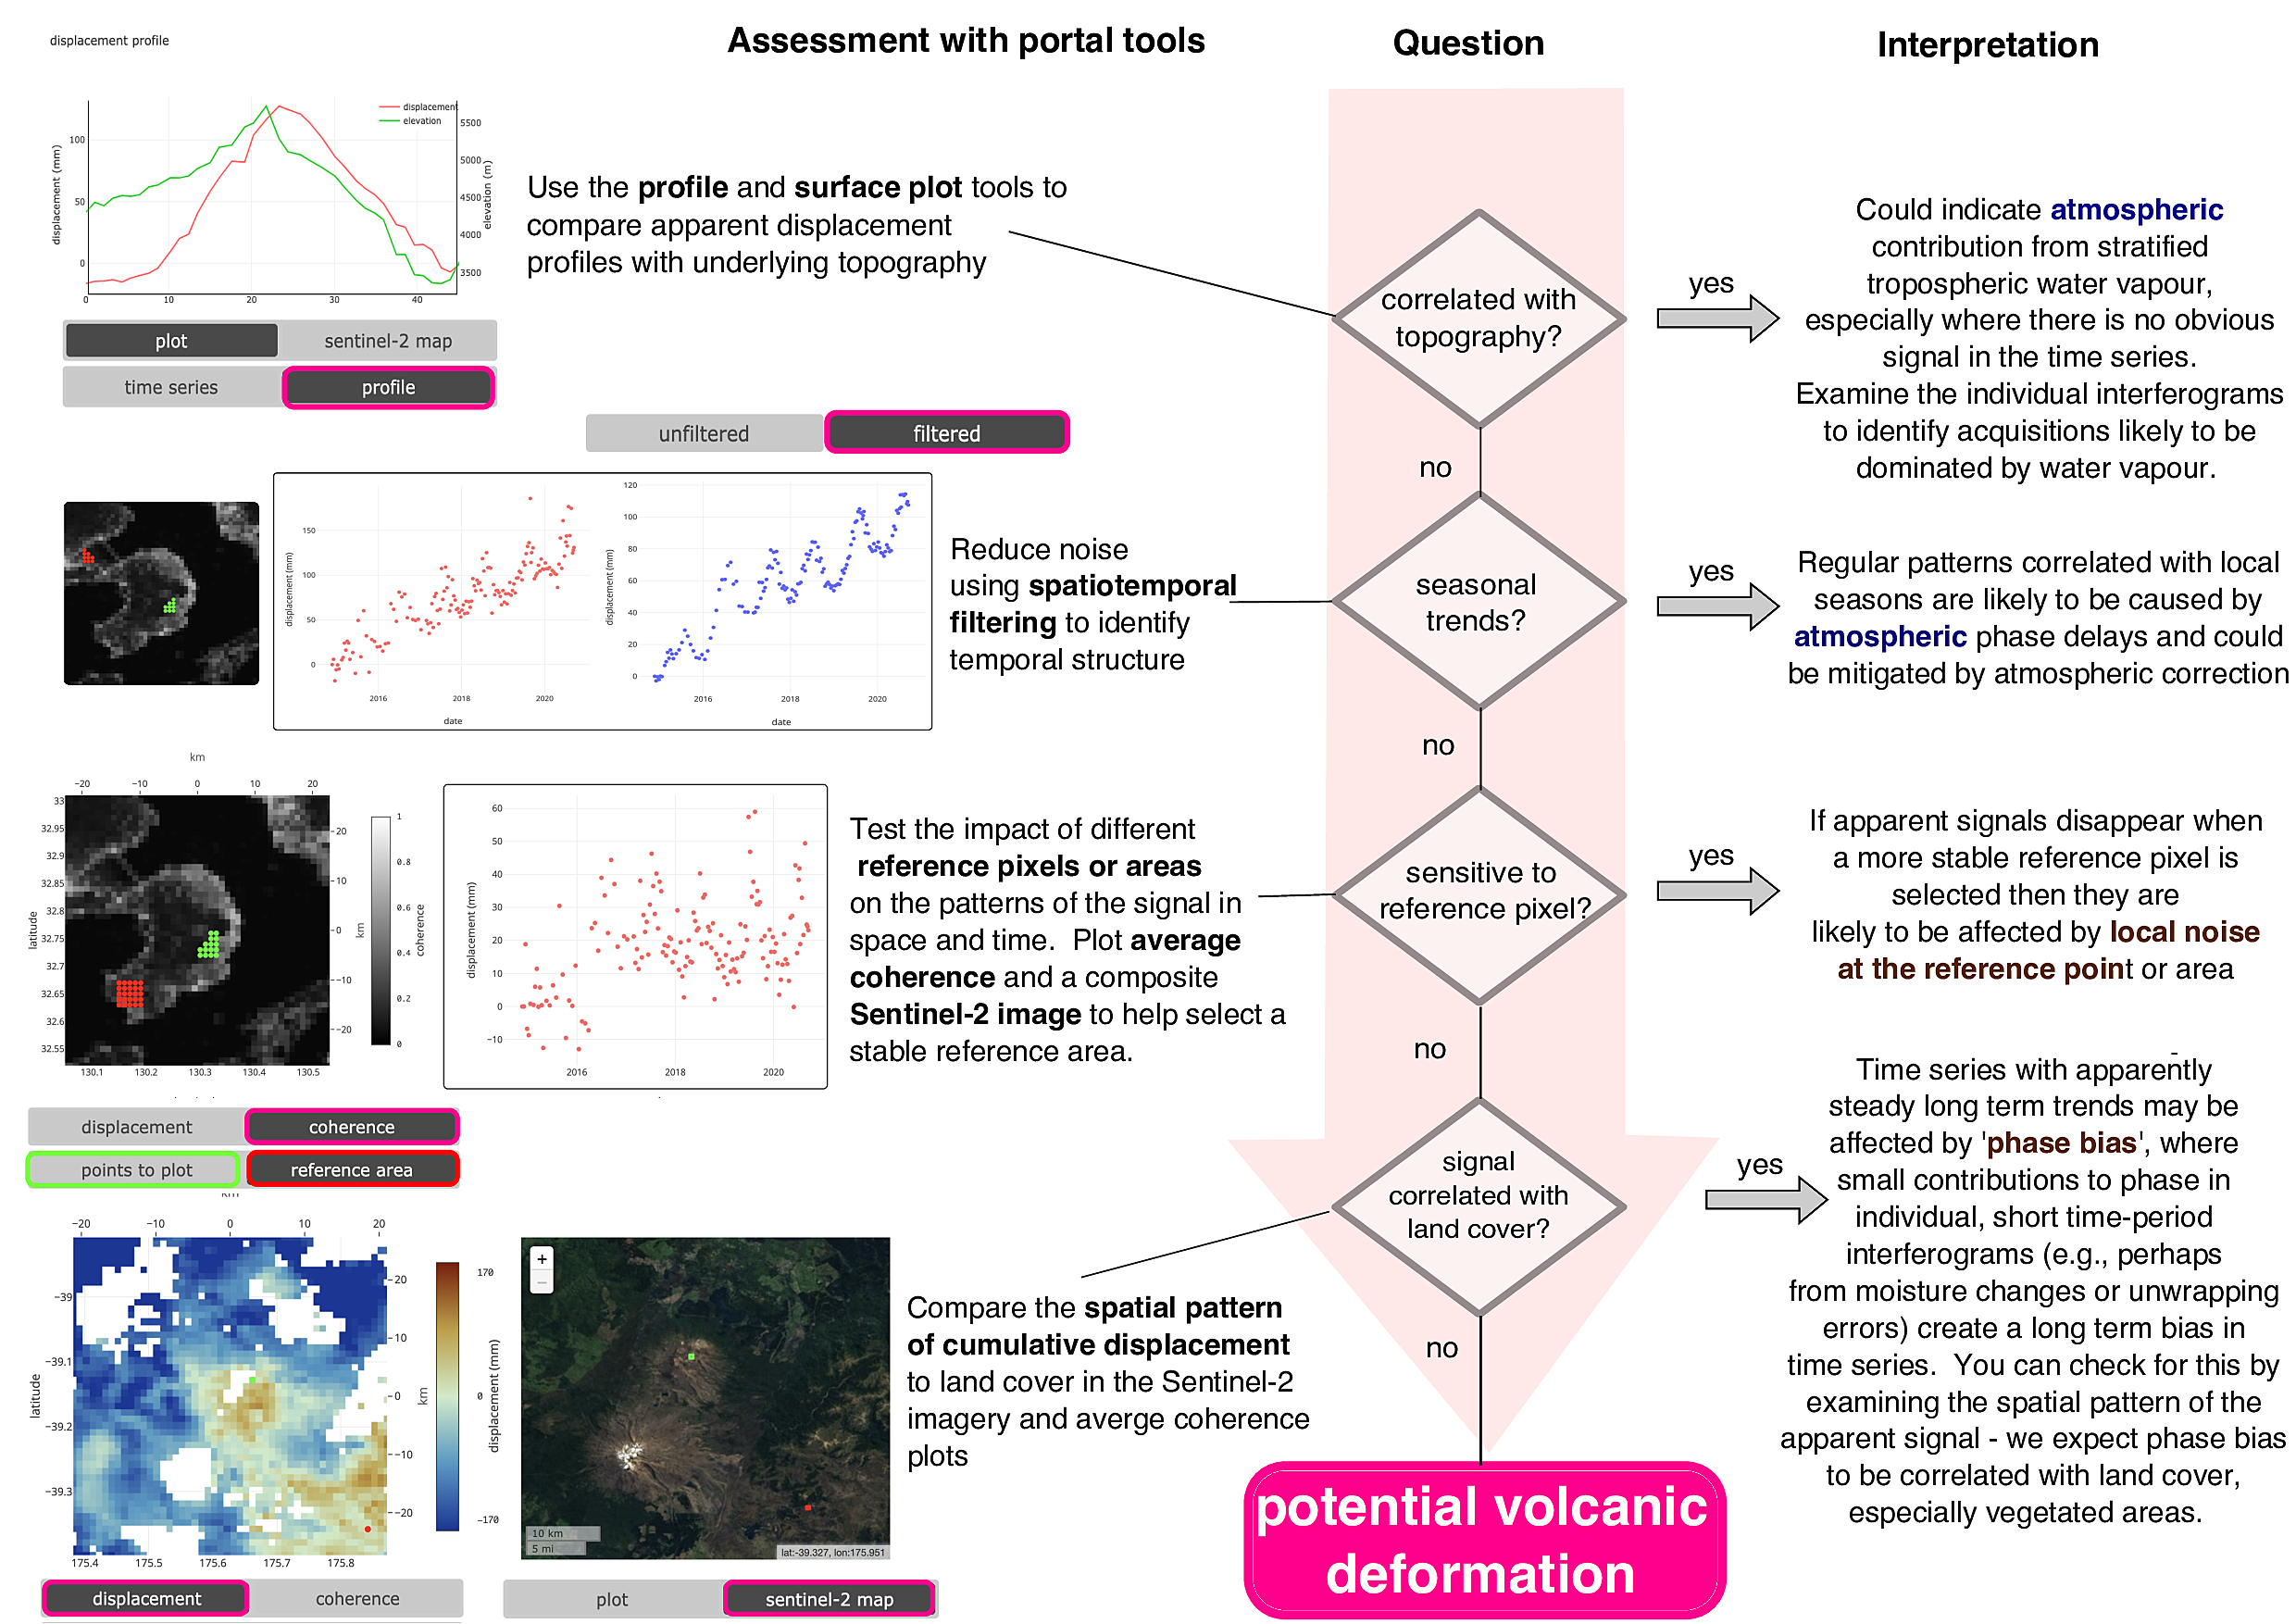
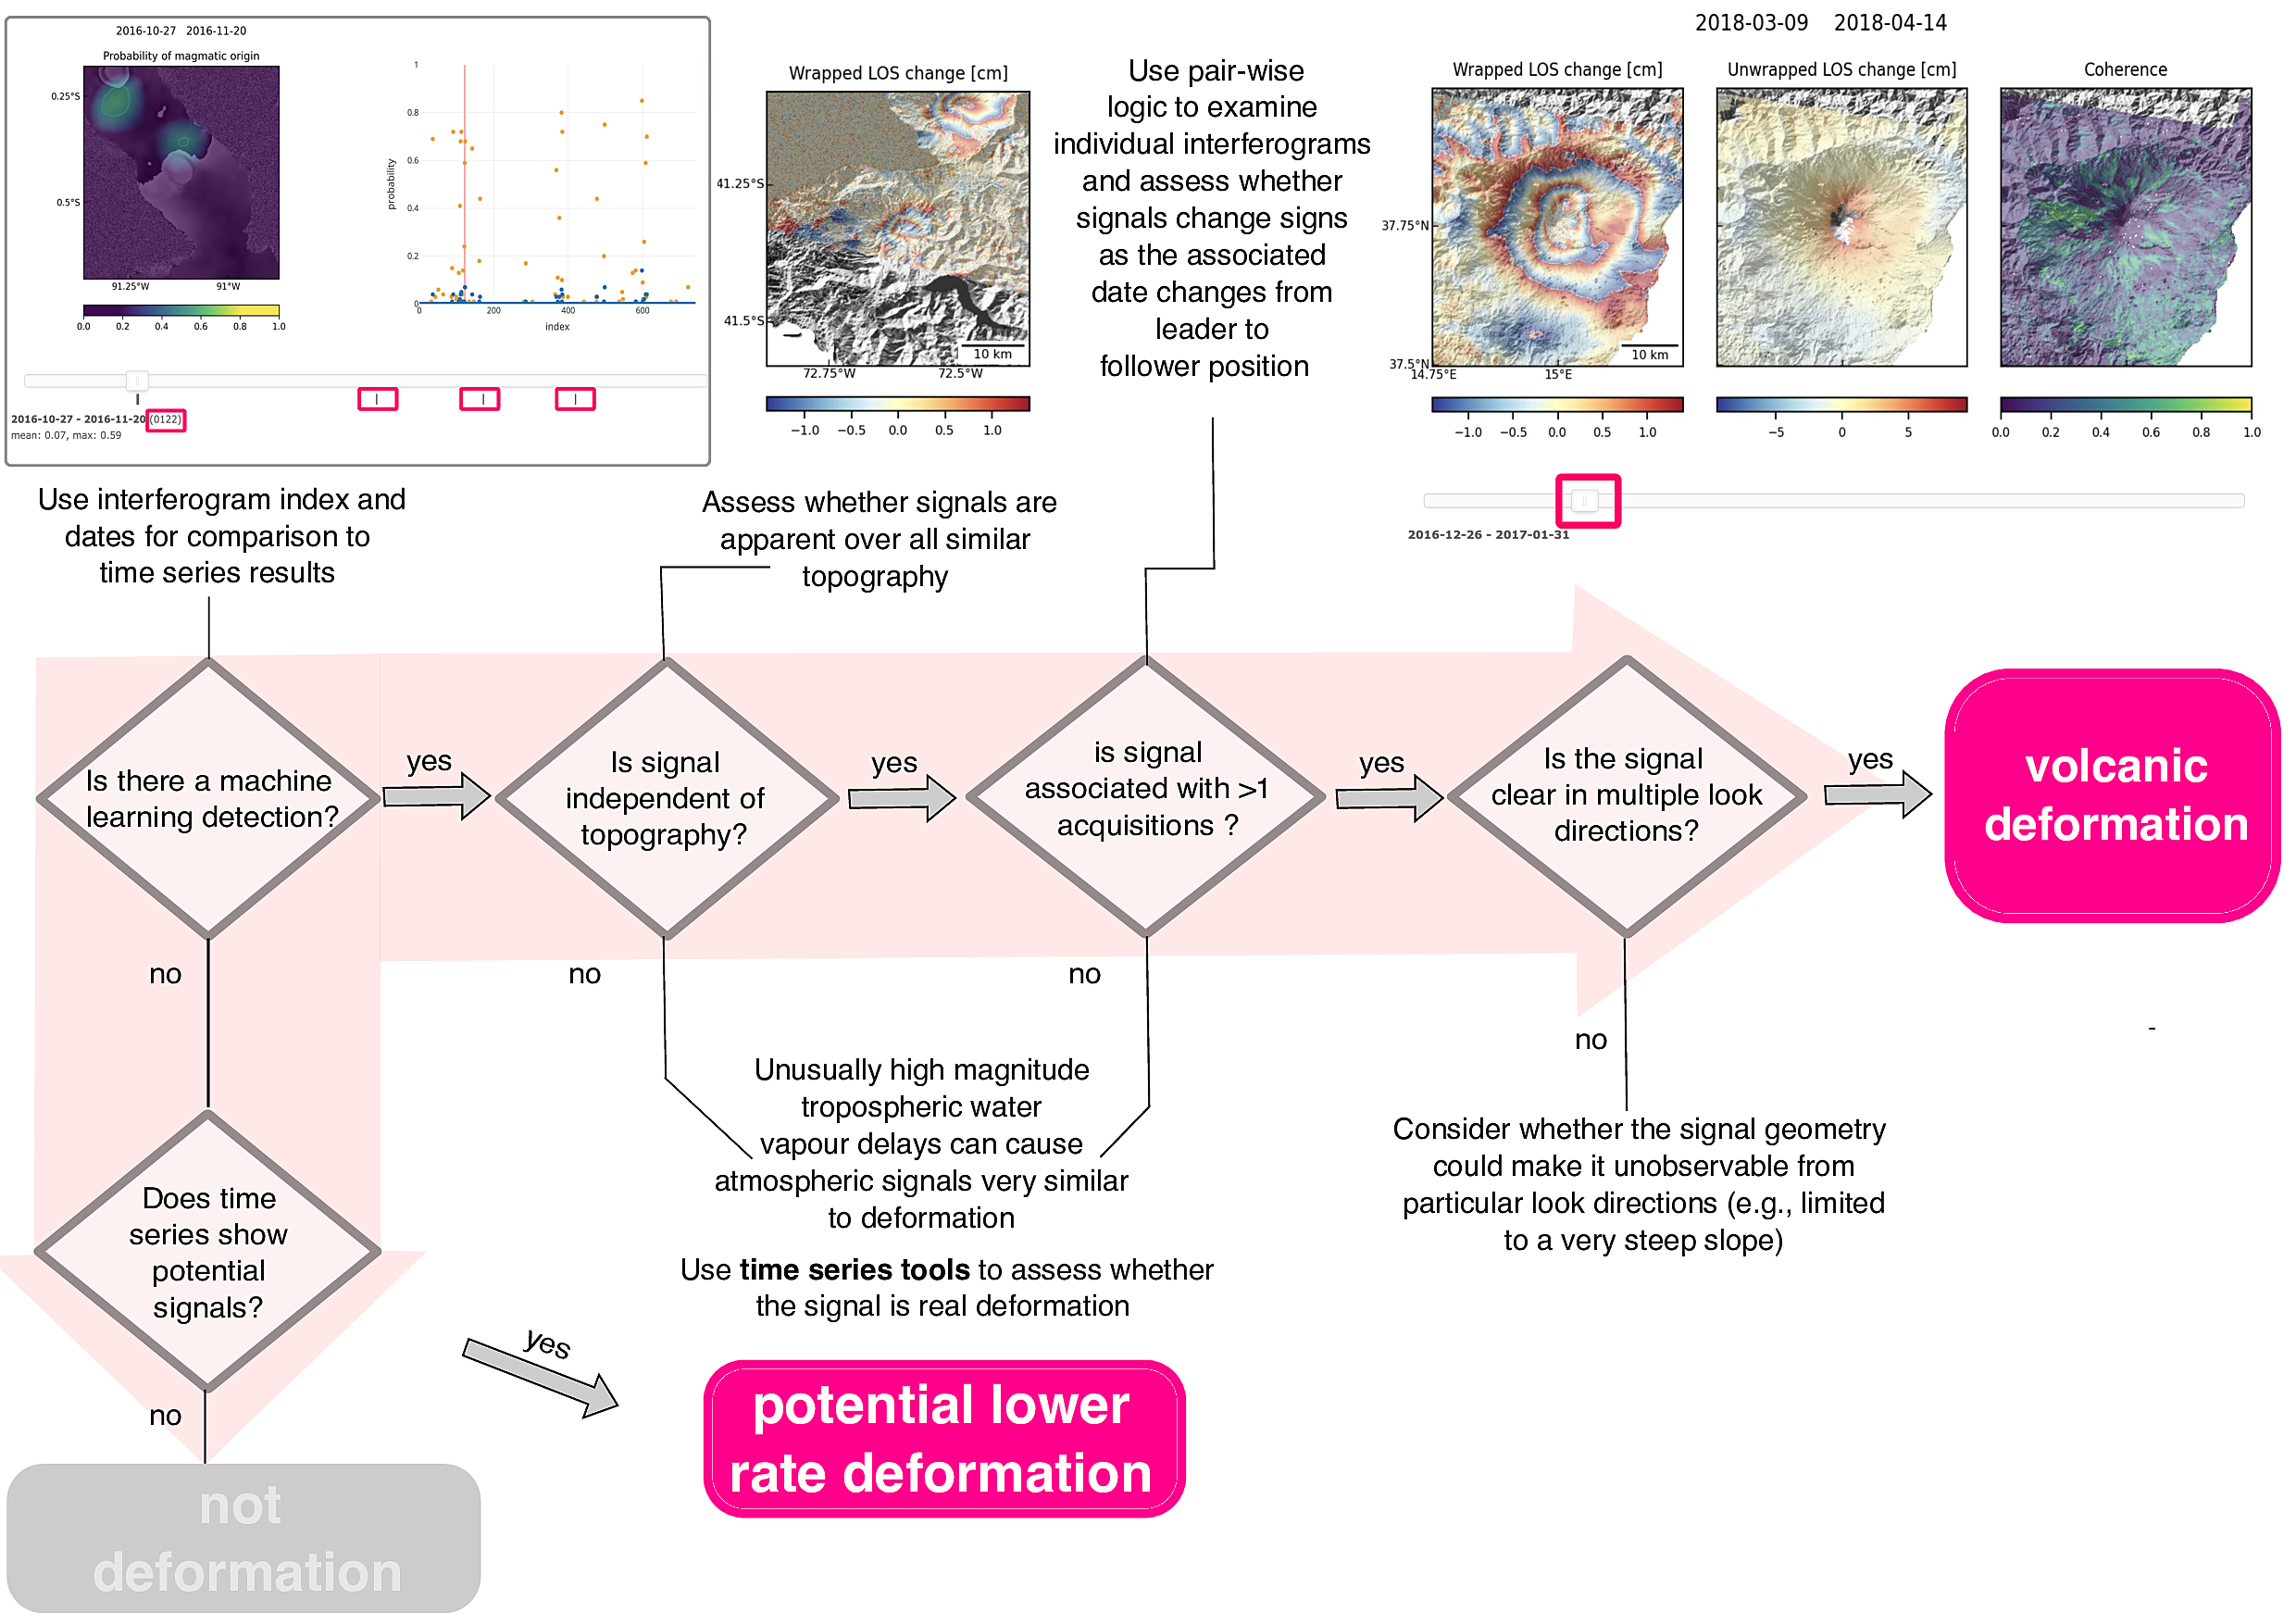
The aim of our tools is to make Sentinel-1 interferograms accessible and interpretable online, without requiring local computing. We have designed the tools to allow users to interrogate the InSAR data and assess for themselves the likelihood of the data showing volcanic deformation. Please use the flow charts below as a guide to how to use the tools. The questions that we suggest are not necessarily diagnostic of either deformation or a particular source of noise by themselves, but should help establish the reliability of any suspected volcanic deformation signal.